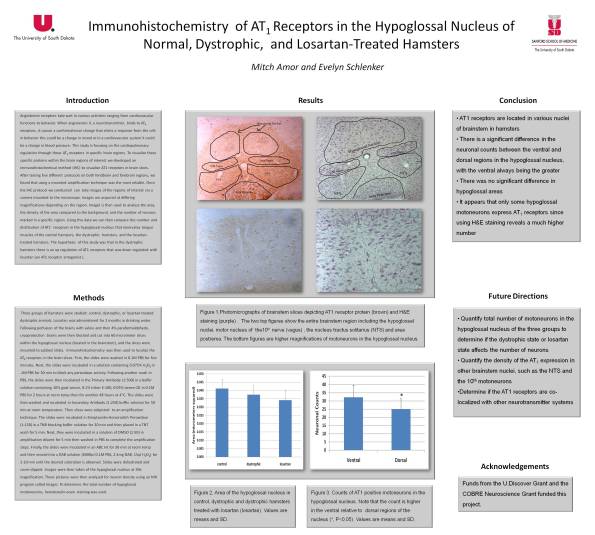
Poster
I finished my poster today and was surprised that it only took a few hours to put together. The abstract we wrote earlier came in handy for an intro and I actually kind of enjoyed making this…
Hematoxylin-Eosin Stain
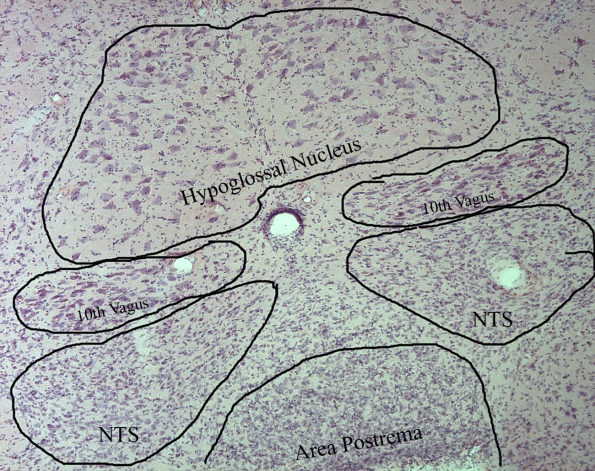
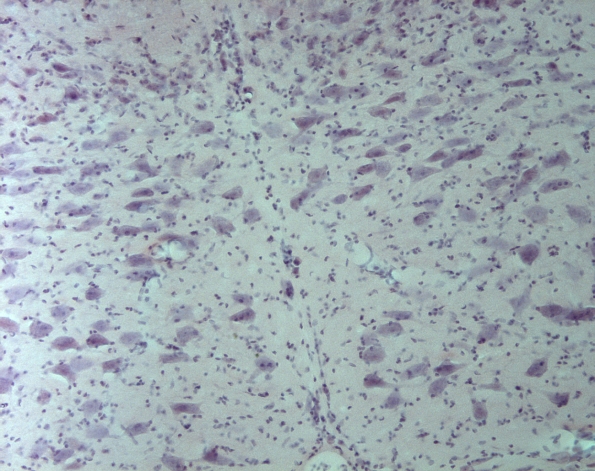
Today I finished my H&E staining for the different regions of the brain. The staining protocol consists of about 25 different steps and takes about an hour to stain 24 slides. The hematoxylin dye is used to stain the nuclei of the cells purple and the eosin dye stains the cytoplasm around the nuclei a shade of pink. We are using the H&E stained brain slices to count the total number of neurons in the hypoglossal nucleus, which we can then compare to the total number of AT1 positive neurons (the immunohistochemistry stuff) to see if there is a correlation. Like the AT1 groups, I used a control group, a dystrophic group, and lostaran treated dystrophic group to make the comparison. I have yet to gather data but in the mean time here are some pictures….
Draft Paper
Here’s a start. I’ll post a longer version soon
Abstract
Angiotensin receptors take part in various activities ranging from cardiovascular functions to behavior. When angiotensin II, a neurotransmitter, binds to AT1 receptor proteins, it causes a conformational change that elicits a response from the cell; in behavior this could be a change in mood or in a cardiovascular system it could be a change in blood pressure. This study is focusing on the cardiopulmonary regulation through these AT1 receptors in specific brain regions. To visualize these specific proteins within the brain regions of interest we developed an immunohistochemical method. Immunohistochemistry (IHC) is a method for visualizing proteins by attaching antibodies to them so that they can be marked. After testing five different protocols on both hindbrain and forebrain regions, we found that using a mounted amplification technique was the most reliable. Once the slices are done with the IHC protocol we can then take images of the regions of interest via a camera mounted to the microscope. Images are acquired at differing magnification depending on the region. ImageJ is then used to analyze the area, the density of the area compared to the background and the number of neurons marked in a specific region. Using this data we can then compare the density of receptors between the hypertensive group, the normotensive group, and the Captopril-treated group to see if there is an up regulation or down regulation of AT1 in correlation to changing blood pressures.
Draft
The renin-angiotensin system (RAS) has always been focused solely on the peripheral systems of the body. This makes sense because all of the needed components of the RAS are found in peripheral organs, i.e. renin is produced by the kidneys, angiotensinogens are synthesized in the liver, etc. but new studies show that all of these components can be localized within the brain itself. To aid in understanding the function of the brain on the RAS, it is useful to have some background information about the classically viewed model of vasoconstriction in the periphery.
The first component of the renin-angiotensin system is angiotensinogen. This constituent is synthesized and secreted into the blood stream via the liver, and is inactive in this form. When the kidneys produce renin, usually as a response to the sympathetic nervous system (and low water, low blood pressure, and high salt), it breaks apart the molecular structure of the angiotensinogen, thus forming angiotensin I. Angiotensin I, a hormone, is acted upon by an angiotensin converting enzyme (ACE), which is produced by the lungs. ACE converts angiotensin I into angiotensin II and in this final state it can bind to its receptor, termed the angiotensin I receptor, or simply AT1. When angiotensin II binds to its AT1 receptor, it causes the standard signal transduction pathway to elicit a response from the cell. In this system, the response is the constriction of the blood vessels causing the blood pressure to increase.
This classical model of the RAS has always been taught and reviewed in the periphery but the emerging studies showing a localized RAS in just the brain seem to hold merit. It is hypothesized that all of the components of the RAS that are produced in the peripheral organs are also synthesized within the neuronal cells. The first major constituent mentioned in the RAS was the angiotensinogens and it is hypothesized that astrocytes secrete this compound into the cerebrospinal fluid. It is worth noting that cultured neurons also can excrete angiotensinogens. With the presence of angiotensinogens, only enzymes are needed to carry out the rest of the steps of the RAS, and it is thought that neuronal mRNA carries the code for producing these proteins. The other major players yet to be mentioned are the AT1 receptors, which have been mapped throughout the brain region.
July 6
Since my advisor has been out of town for the last week, I have had time to start catching up on my draft paper and presentation for the U.Discover. I’m the first person to present this Tuesday and I do have some easy-to-understand topics, or so I think. As far as research is concerned, I plan on finishing the slicing/mounting on Wednesday but I’m not sure how to do the staining, since it’s a new protocol for me, so that will have to wait until Dr. Schlenker is back.
July 1, 2009
Today I started sectioning more brains for an anatomical study of just the neurons. We plan on looking at all of the neurons in the hypoglossal nucleus to compare it to my findings of the ones with the AT1 receptors to see if there is any important correlations. I also filled out more paperwork so I can start handling live animals because we are going to start a study on breathing.
June 22nd, 2009
Today I finished taking pictures through the microscope, which came to a grand total of 205 images. With this many pictures I will be able to gather tons of useful data. I havent really explained why we are interested in the AT1 receptors yet on this blog so I’ll do a brief overview now. The animals (rats and hampsters) have been split into four groups (not mixed between species). The groups consist of the hypertensive (high blood pressure) animals, the normotensive (regular blood pressure), the captopril-treated hypertensive group (high blood pressure given a drug to lower it), and the hypertensive group that was briefly given captopril then taken off of it. The reason why we are interested in this study is because when you give the hypertensive rats captopril to lower their blood pressure but then stop giving the drug to them you would expect that their blood pressure would go back to a hypertensive range (about 160 mmHg). Instead it stays about 20-30 mmHg lower than it was originally, even though the drug has not been administered for weeks. We are trying to find a change in the amount of these AT1 receptors (proteins) in the brain to see if we can explain the lowered blood pressure off the drug. The simplified version behind raising your blood pressure is when your body binds angiotensin II (a neurotransmitter) to its receptors, AT1, and this causes vasoconstriction (narrowing of the blood vessels) to increase the pressure. Its kind of alot of information to try to decypher at one time but thats a brief overview of the project I’m working on right now. Tomorrow I am going to start gathering the data which I do have some pictures to explain it visually.
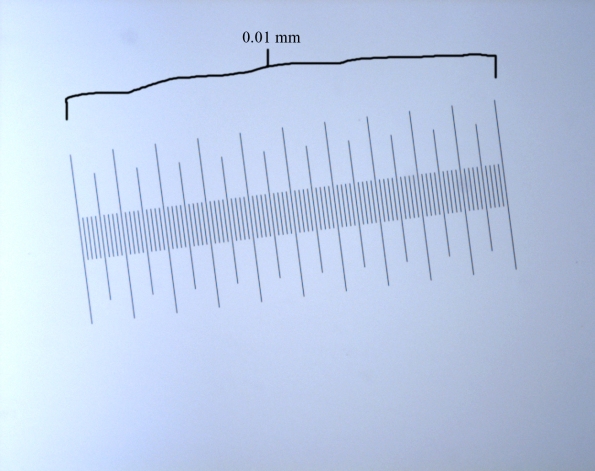
Here’s a picture of the scale at 10x magnification. This enables me to measure the area of the brain regions by setting a scale from pixels to mm.
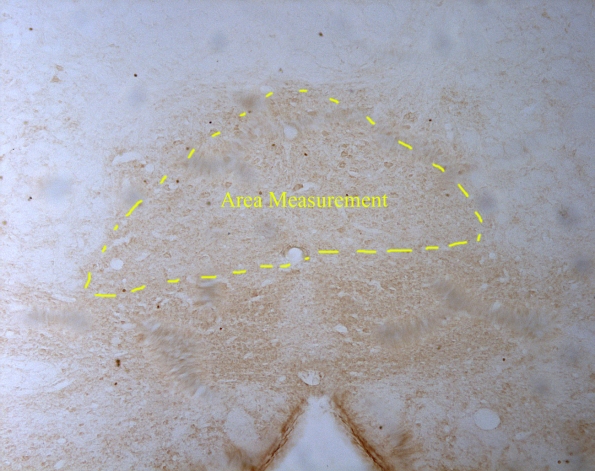
This is a picture of the Hypoglossal Nucleus at 10x. I am measuring the area inside the yellow dotted lines.
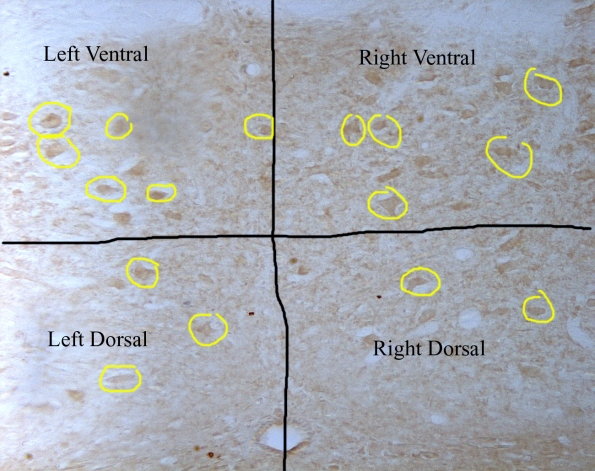
This is a picture of the ventral and dorsal regions that I am counting neurons in. This is of the hypoglossal nucleus at 40x. Some of the neurons are circled in yellow.
Brainstem Regions and Pictures
After I completed day 2 for the mounted amplification technique on the hampster slices I took pictures through the microscope of the regions we are studying.
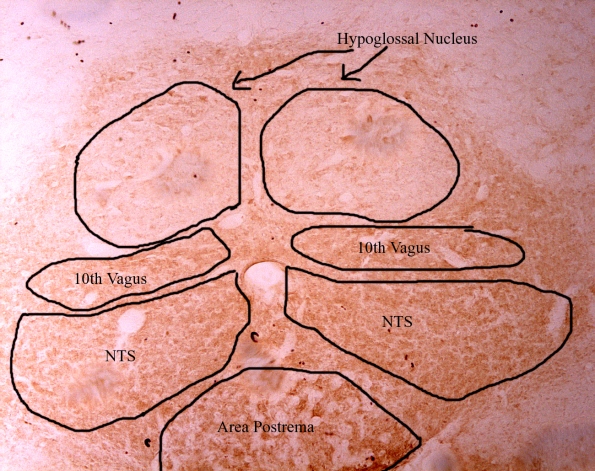
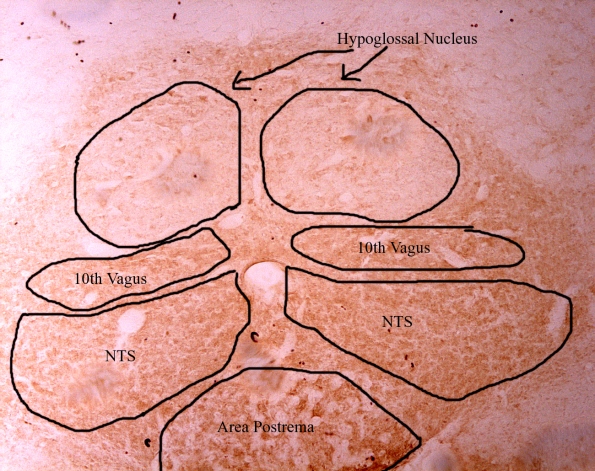
Here’s a picture at 10x magnification on the brainstem where you can see the different brain regions conveniently on one slice. The darker (brown) regions are marked, which means that they have AT1 receptors within them.
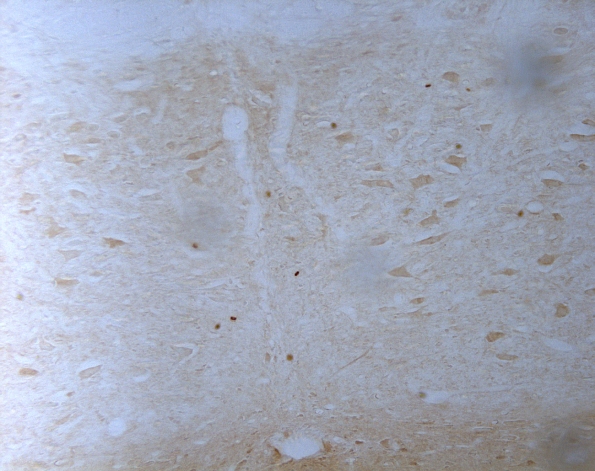
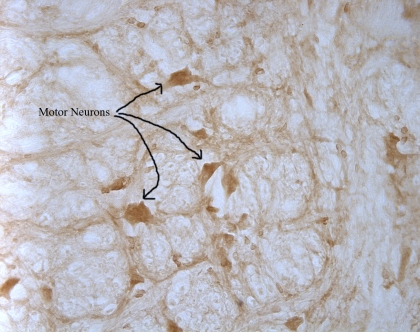
Here’s the above picture at 40x magnification in the hypoglossal nucleus. You can see that the neurons have alot of AT1’s on them by the dark brown color.
Visualizing AT1 Receptors Using Immunohistochemistry
Here’s a condensed version of the modified protocol we assembled to visualize the AT1 receptors on the brain tissues of hampsters….
- Wash the slides 3x in 0.1M PBS for 5 min
- Wash in .075% H2O2 for 30 min in .1M PBS
- Wash the slides 3x in 0.1M PBS for 5 min
- Incubate in the Primary Antibody (1:500) in a buffer solution containing 10% goat serum, 0.1% triton X-100, 0.05% tween-20 in 0.1M PBS for 2 hours at room temp then for another 48 hours at 4°C.
- Wash the slides 3x in 0.1M PBS for 5 min
- Incubate in the Secondary Antibody (1:250) for 50 min at room temp in the buffer solution
- Wash the slides 3x in 0.1M PBS for 5 min
- Incubate in Streptavidin-Horseradish Peroxidase (1:150) in a TNB blocking buffer solution for 30 min.
- Wash 3x in TNT wash for 5 min
- Amplification for 5 min in DMSO (1:50) in amplification diluent.
- Wash the slides 3x in 0.1M PBS for 5 min
- Incubate in ABC kit for 30 min
- Wash the slides 3x in 0.1M PBS for 5 min
- Incubate in DAB (6000µl 0.1M PBS, 2.4mg DAB, 15µl) for 2-10 min until desired coloration is obtained
